The origins of the Elliott Wave Theory date back to the accountant Ralph Nelson Elliott, who developed it in the 1930s after observing recurring patterns in price movements within financial markets. Elliott referred to these patterns as “waves,” and he published his vision of market movements in his book The Wave Principle in 1938, later reinforcing his ideas with a series of articles in Financial World Magazine in 1939.
The theory is based on the idea that financial markets, and even various aspects of life, move according to a five-phase directional pattern. These waves are driven by investor psychology, where market sentiment alternates between optimism and pessimism, which reflects in price movements. These fluctuations can be deduced through analyzing charts and price trends.
Elliott Waves is considered an advanced analytical tool in financial markets, especially in forex, as it enables traders to identify market patterns and seize potential opportunities with greater accuracy. This theory is notable for its ability to predict future price trends based on the collective behavior of investors, giving professional traders a competitive edge over beginners.
How Elliott Waves Work?
Ralph Elliott believed that price movements in markets are not random but follow a repeating structural pattern made up of smaller waves that merge together to form larger waves, which in turn combine to create even bigger and more complex waves. Each group of waves forms part of a larger wave extending over a longer time frame.
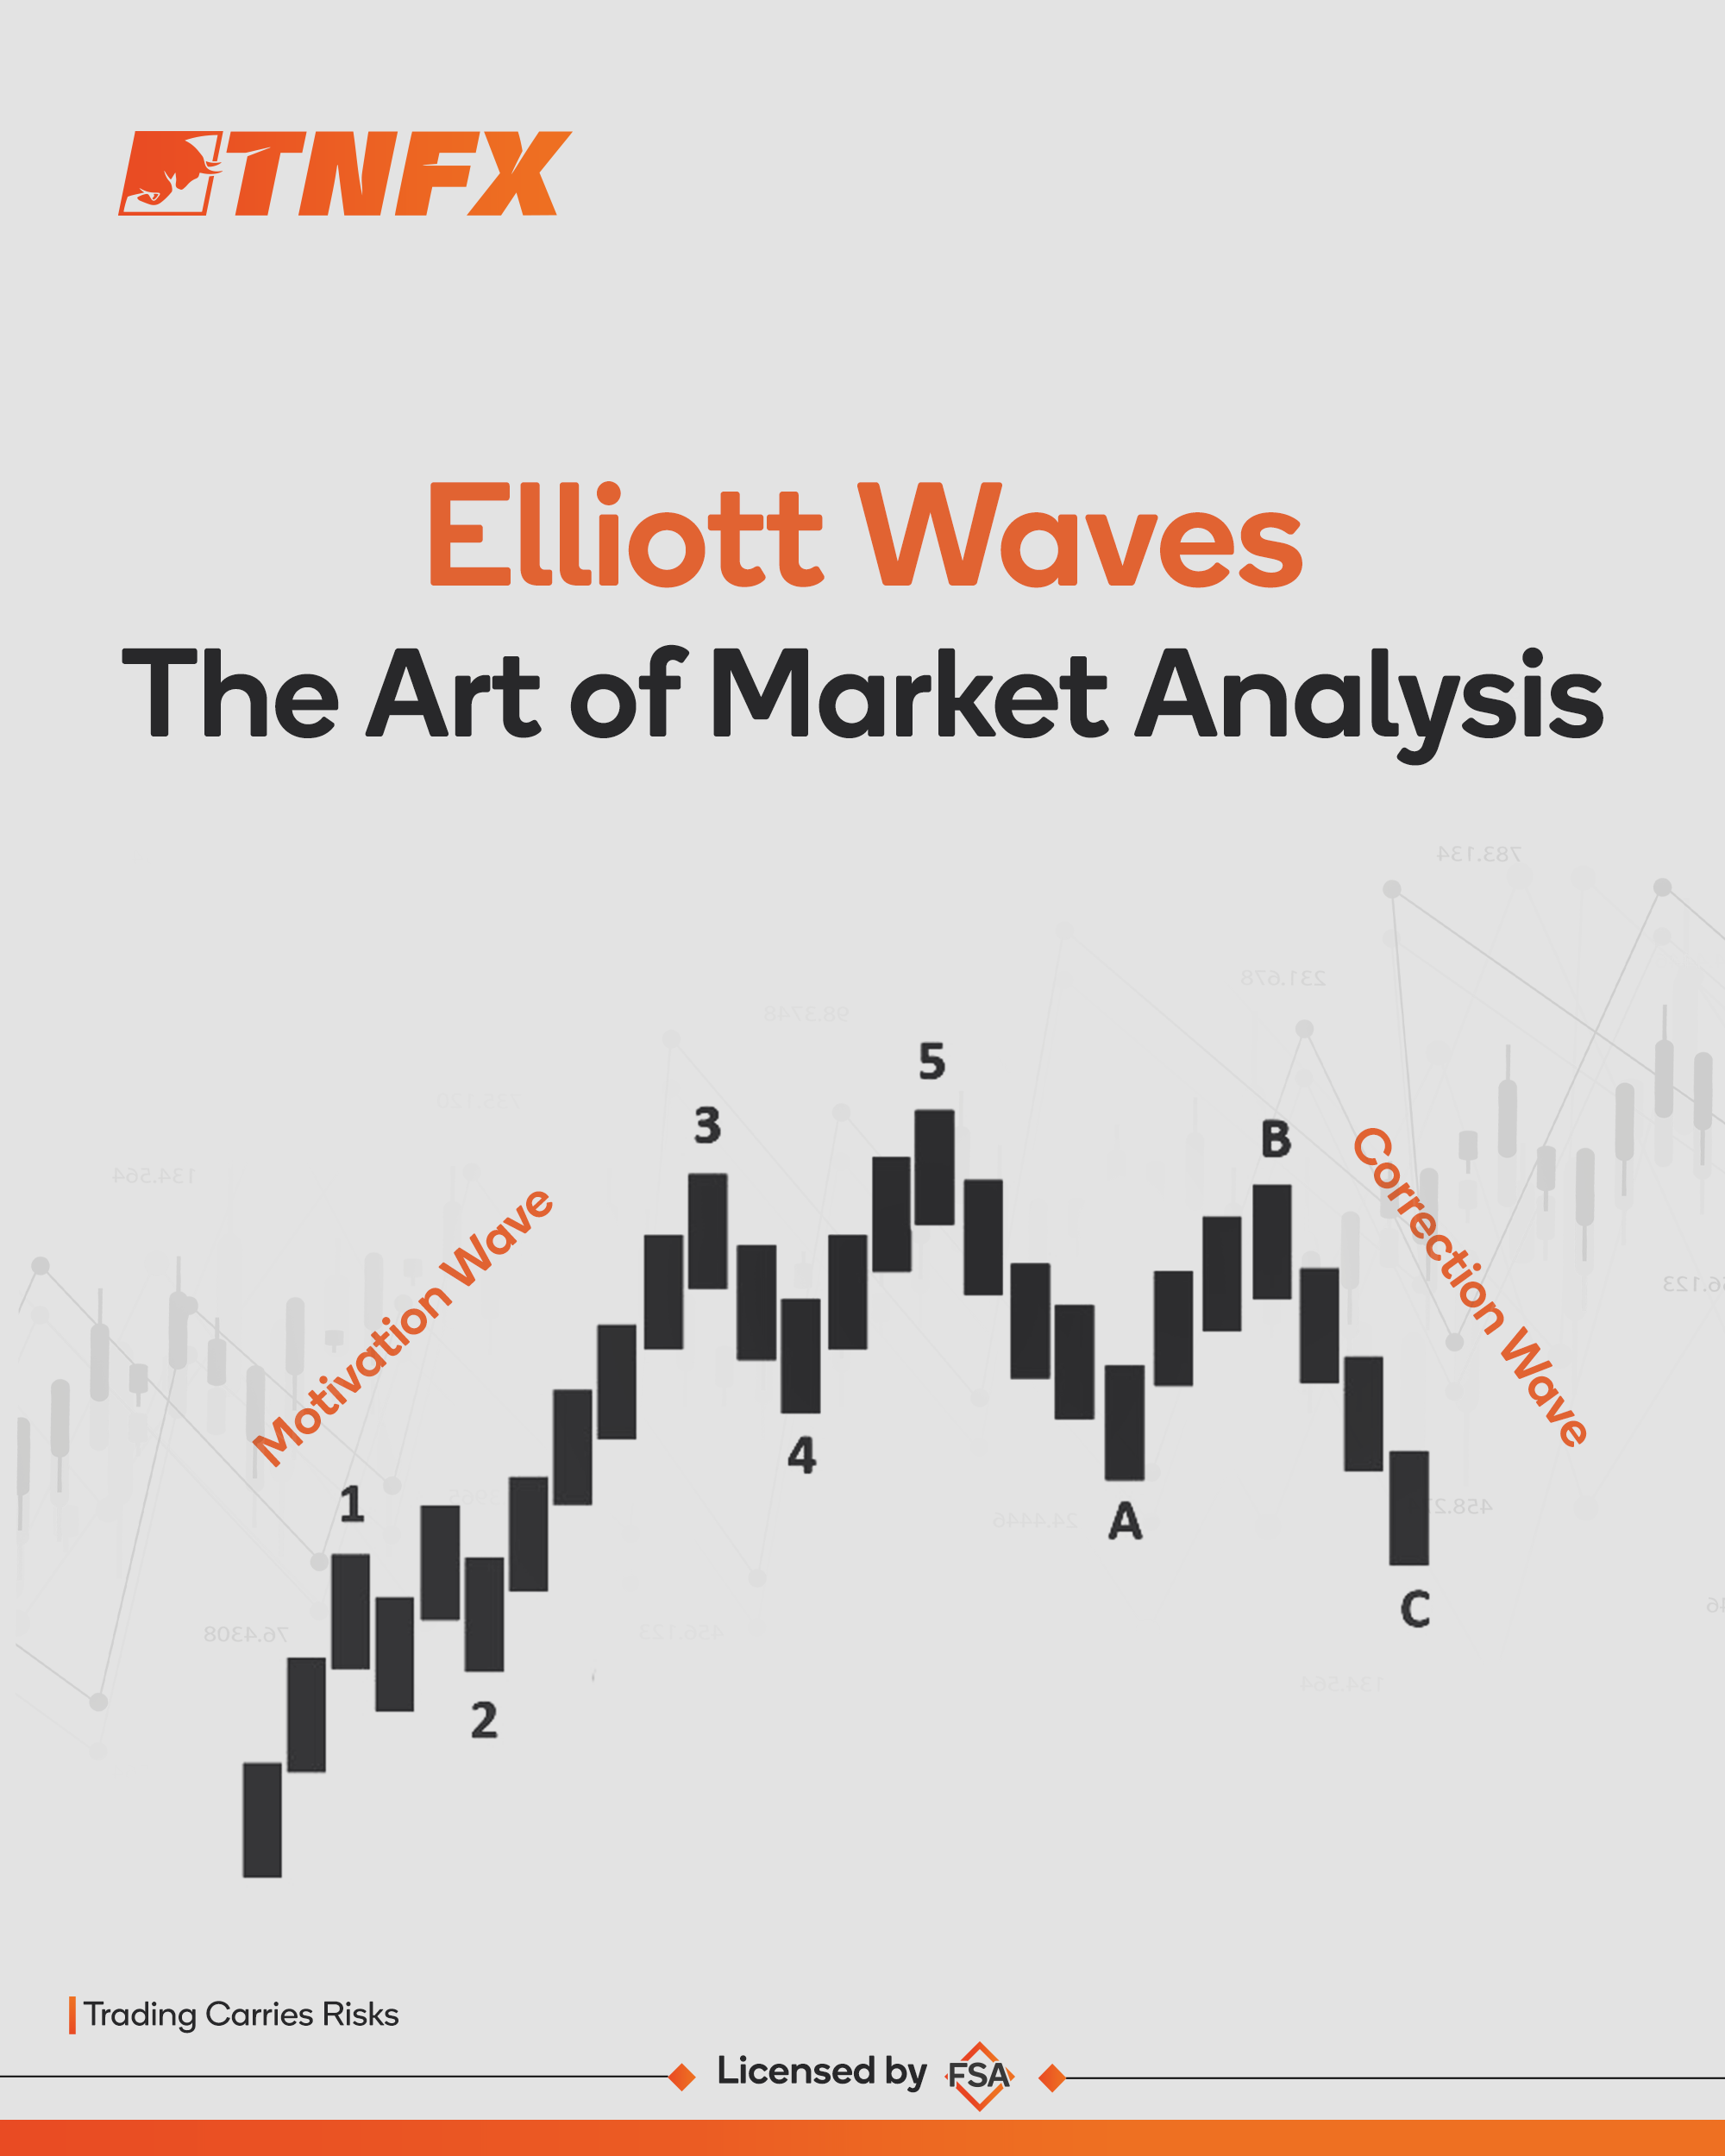
According to Elliott’s theory, waves are divided into two main types:
1. Impulsive Waves: These waves follow the main market trend and are usually made up of five numbered waves (1-2-3-4-5).
o Waves 1, 3, and 5 move in the direction of the larger wave.
o Waves 2 and 4 are corrective waves that move against the main direction.
2. Corrective Waves: These form after an impulsive wave and serve to correct part of the previous movement, creating a temporary balance before the general market trend resumes.
Once an impulsive wave completes, it becomes part of a larger impulsive wave on a broader time frame. When four impulsive waves are formed at a higher level, they can be considered part of a larger impulsive wave, and so this cycle continues repeatedly in the financial markets.
This mechanism makes Elliott Waves a powerful tool for analyzing market trends, as it can be used to predict future price movements based on previous wave patterns.
Interpretation of Elliott Waves
The impulsive wave consists of five waves, each reflecting investor behavior and interaction with market movements:
• Wave 1: Prices begin to rise as a small number of buyers enter the market, seeing the current price as low and a good buying opportunity.
• Wave 2: A slight correction in price occurs due to some buyers from Wave 1 taking profits, causing a temporary drop, but the price does not fall below the start of Wave 1.
• Wave 3: This is the strongest and most active wave, where more investors notice the upward trend, leading to increased demand and higher prices, surpassing the peak of Wave 1.
• Wave 4: Another smaller correction occurs, where some investors sell to take profits, but there are still new buyers entering, and investors who haven’t sold their positions, maintaining the overall upward trend.
• Wave 5: The price continues rising to a peak as more investors are drawn in by the buying momentum. At this stage, the market may reach a state of buying saturation, increasing the likelihood of a corrective wave of a higher degree, consisting of smaller waves moving up and down.
Once the five waves are completed, prices begin correcting according to the corrective wave pattern, offering new opportunities for traders to capitalize on price fluctuations.
General Conditions for Elliott Waves
1. The second wave must not fall below the level of the first wave.
2. The third wave must not be the shortest among the impulsive waves (1, 3, 5).
3. The fourth wave must not overlap with the third wave in the same price zone.
Accuracy of Elliott Waves
Although studying Elliott Wave Theory may seem straightforward and clear in theory, its practical application can be relatively complex. The theory has not proven to be 100% successful, as identifying patterns in financial markets can be challenging even for professionals, especially with different timeframes.
Due to its widespread use, it has become an independent branch of technical analysis known as “Wave Analysis.” Therefore, it is crucial to delve into studying and experimenting with the theory for a sufficient period using demo accounts, as continuous practice may lead to greater success in mastering it.
It is also highly recommended to use other analytical tools alongside Elliott Waves, such as technical indicators or fundamental analysis, to improve prediction accuracy and increase the chances of successful trading.