It is one of the most famous methods of technical analysis of stocks or forex and is due to the Japanese method that was obtained with visual clarity from the beginning. The year 1980 is one of the most popular methods of technical analysis.
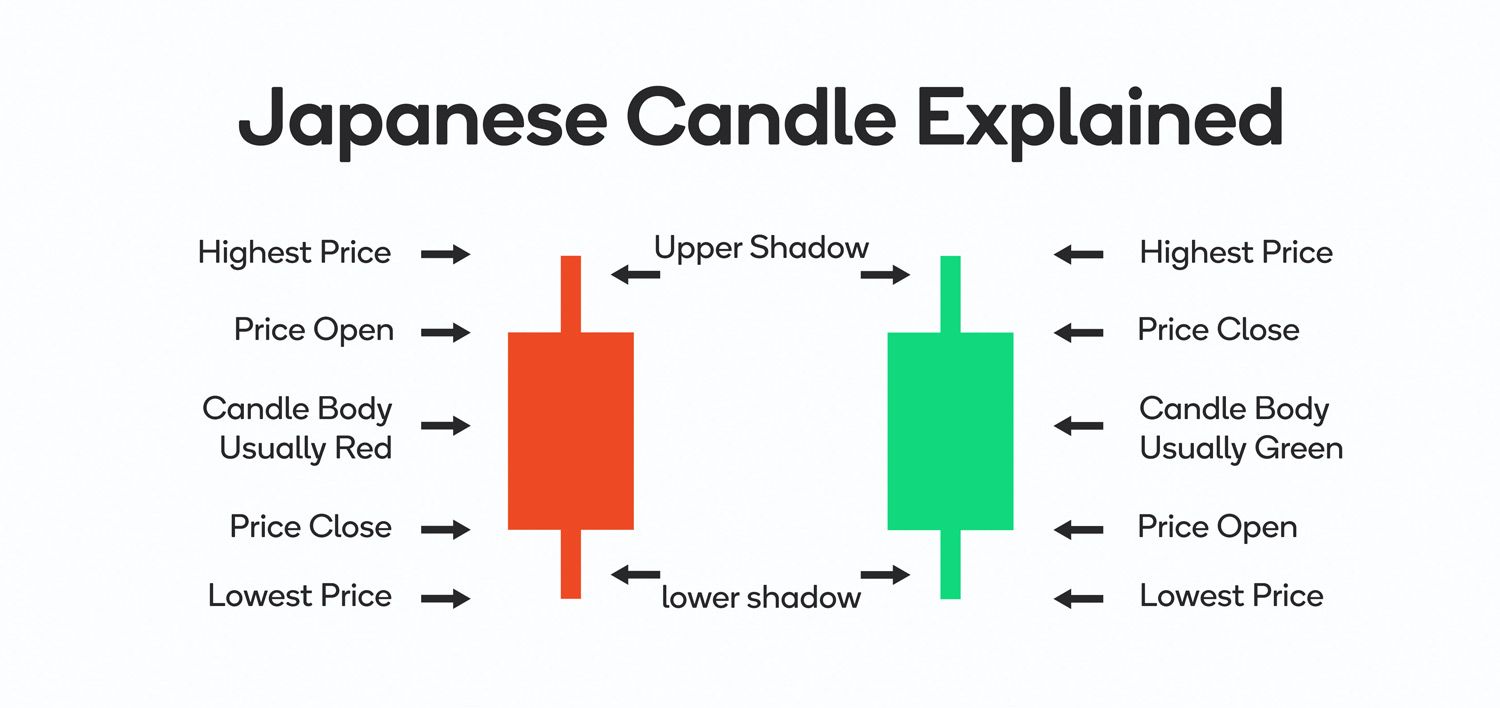
Overview of properties for sale A larger graphic image to display graphically the forces “supply and demand” that contribute to the price movement in each time period, the length of the candle body and shadows.
When the Japanese stock market began in the “1870s” local technical analysts incorporated the “Homma” methodology into the trading process, American technical analyst “Steve Ness” ran this technique to the West by writing a book called “The Japanese Division Drawing Technique“
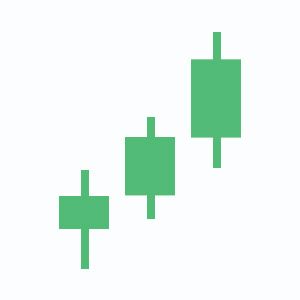
Japanese Candlestick Chart provides graphical tables showing the supply and demand graphs in the chart for each time period, showing the same data as the bars (opening, close, lower limit, upper limit) as shown in the figure below
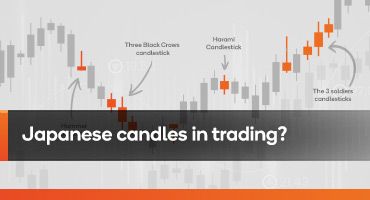
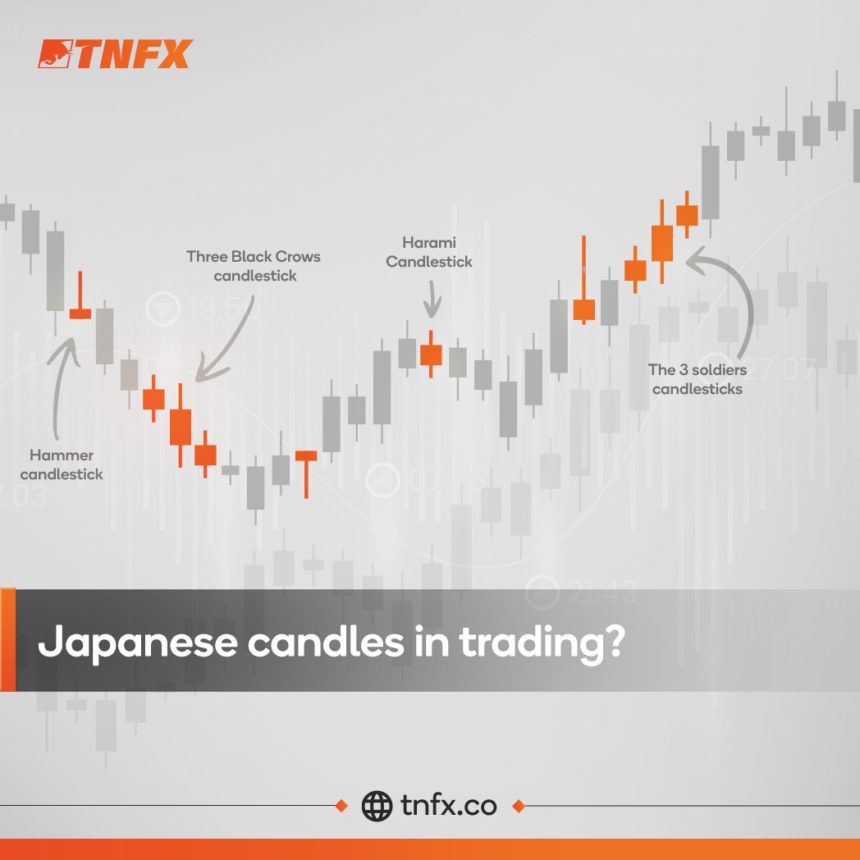
Japanese candlesticks are patterns that traders use to analyze price action. There are a lot of Japanese candlestick patterns that you will encounter during trading operations, whether up or down, but these are the most famous:
1. Hamme candlestick

2. Inverted Hammer candlestick

3. Harami Candlestick

4. Shooting Star candlestick

5. Hanging Man candlestick

6. Piercing Line candlestick

7. Bullish/Bearish Engulfing candlestick


8. Dark Cloud candlestick

9. Three Black Crows candlestick

10. The 3 soldiers candlesticks
11. Morning Star candlestick

12. Evening Star Candlestick